MM0704, Lesson 1
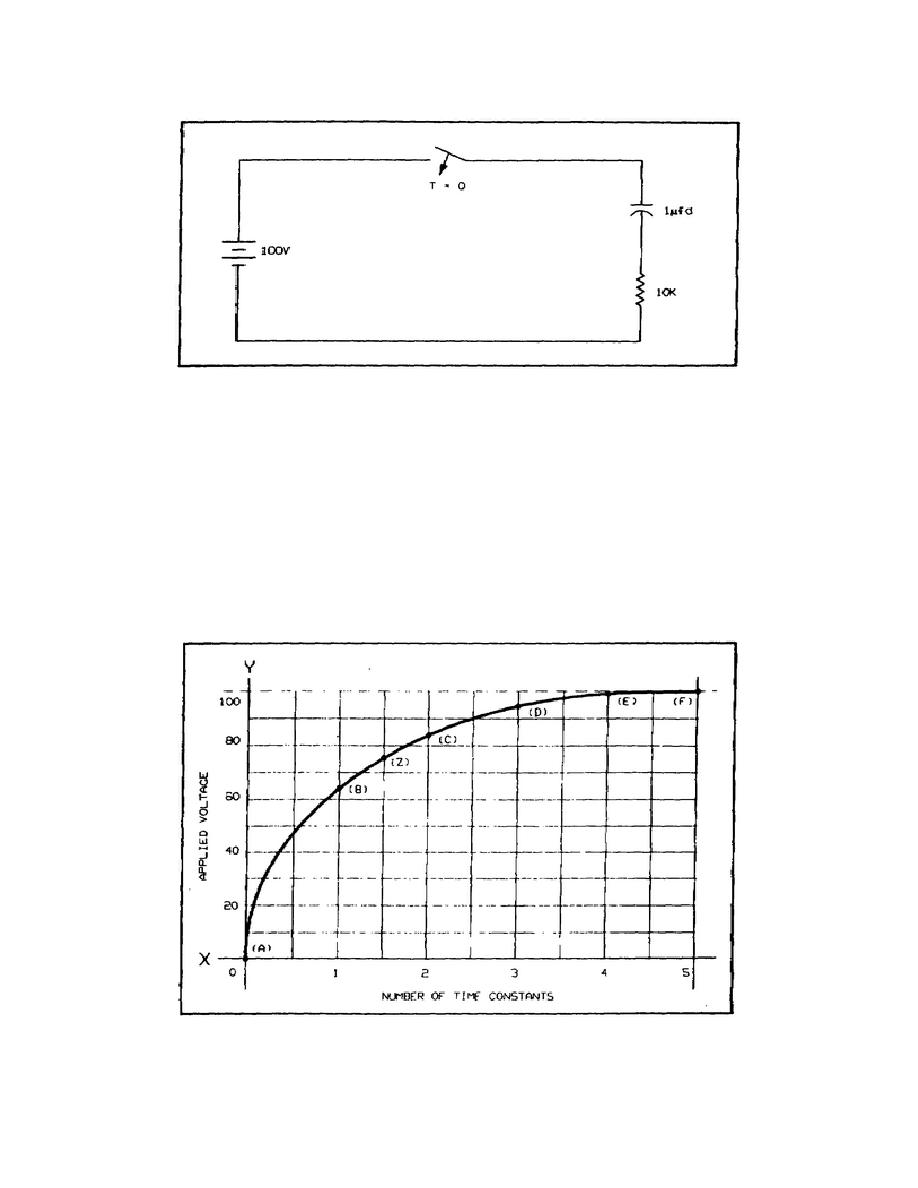
Figure 1-16. Series RC Circuit.
you cannot assume that the voltage will be midway between the 63.2 V and 86.5 V (74.8 V) at 1.5 TCs. Hence, some
arrangement must be made to show all the intermediate situations between whole time constants.
At any time, the voltage and current of any component can be calculated mathematically by the use of calculus. It can
also be done more simply by plotting a graph of the percentage of change using values for each whole time constant.
See figure 1-17. The first instant that voltage is applied to a series RC circuit (zero time constant), the percentage of
applied voltage across the capacitor is zero. This is point A on the graph. One time constant after the voltage is
applied, 63.2 percent of the applied voltage, appears across the capacitor. This is point B on the graph. After 2 TCs,
the applied voltage across the capacitor has risen to 86.5 percent of the applied voltage. This is point C. The voltage
across the capacitor after 3 TCs is 95.1 percent (point D); after 4 TCs, 98.2 percent (point E); and after 5 TCs, 99.3
percent (point F).
Figure 1-17. Percent of Capacitor Voltage.
22


 Previous Page
