c. In a similar way, all values of current can be determined
until the steadystate condition is reached. The voltages and
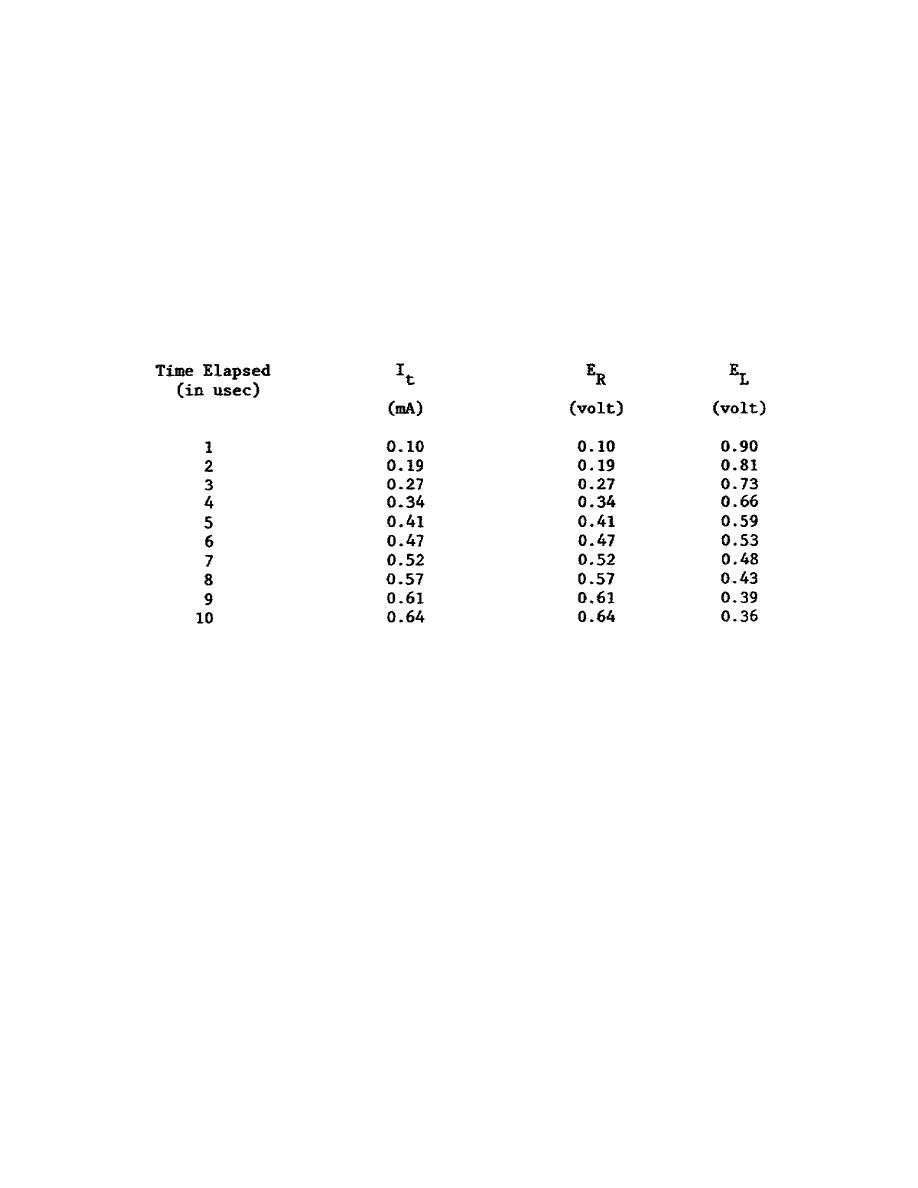
currents at the end of each usec, for the problem just discussed, are
shown in Table II. Check these values with those given for the same
period of time in Table I. The values obtained using the stepby
step procedure are slightly higher, but very close to the actual
values. The response of a series RL circuit to any type of input
voltage waveform can be determined by using these same time constant
and voltage equations.
Table II. Voltage and current values when positive step
voltage is applied to a series RL circuit
Section III. RC CIRCUIT RESPONSE AND VOLTAGE DROPS
9.
GENERAL.
In the following discussion, the voltage, current, rate of
charge, and rate of discharge of an RC circuit are examined at a
number of intervals during the transient period following the
application of positive and negative step voltages.
10.
TRANSIENT RESPONSES.
a. Positive step voltage. The curves in Figure 20 represent the
current and voltage waveforms of a series RC circuit. At the instant
that E is applied to the circuit, Ec is equal to zero, ER is equal to
E, and the current in the circuit is at maximum. At the end of 1
time constant (RC time constants are discussed in Section IV of this
chapter), the current (Curve B) has rapidly decreased to 36.8 percent
of its maximum value. ER (also Curve B) is directly proportional to
It and is, therefore, also equal to
42


 Previous Page
