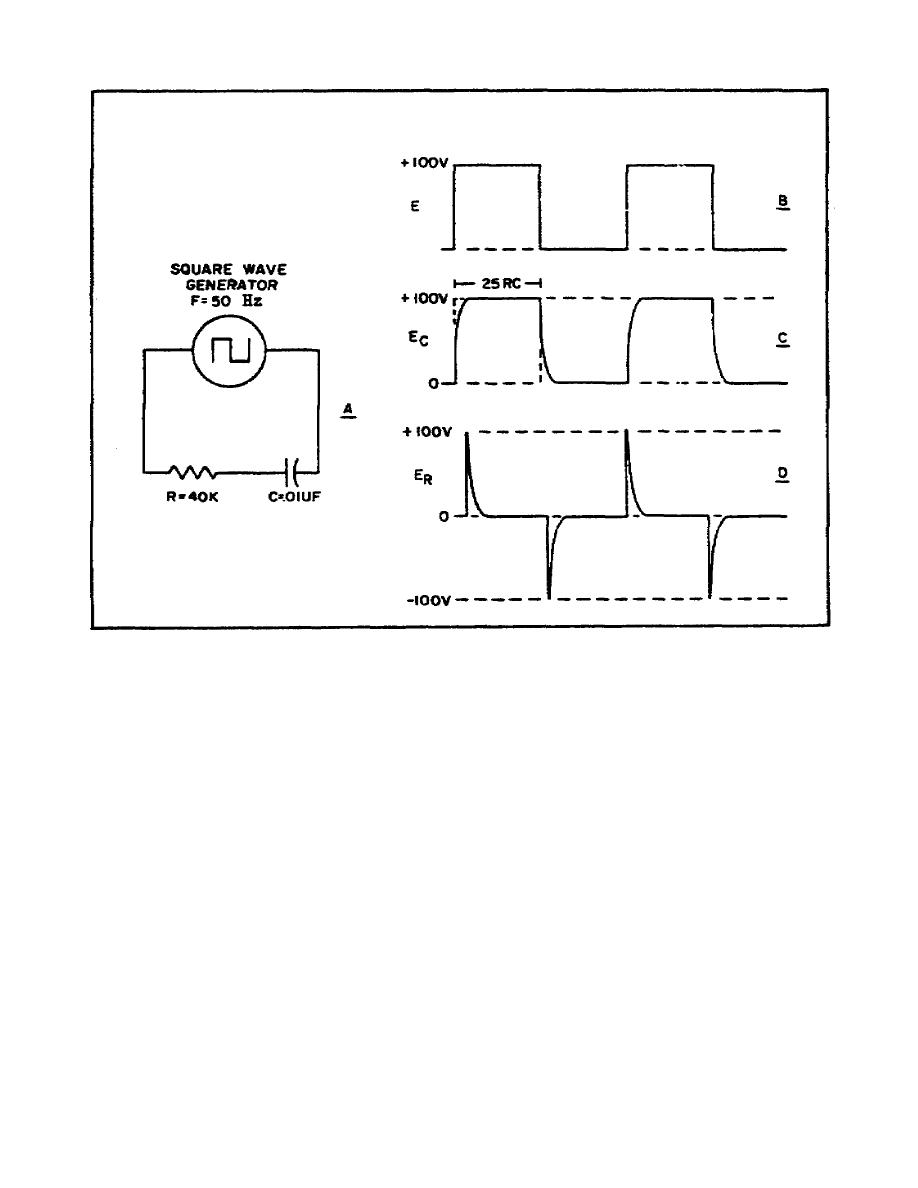
Figure 25. Waveshapes for shorttime constant
RC circuit.
(4) The output waveforms produced by applying a square wave to
an RC circuit having a comparatively longtime constant are
illustrated in Figure 26. Here the time constant is 10 times as long
as the duration of one complete cycle of input voltage of 20 times
the pulse duration time. Referring to the universal time constant
chart (Figure 20), it can be seen that the capacitor in the circuit
will charge almost linearly for about 20 percent of the firsttime
constant. This causes the waveforms of the capacitor voltage (Figure
26C) and the resistor voltage (Figure 26D) to be linear during the
entire half cycle. This also holds true during the second half of
the cycle when the capacitor is discharging from 20 percent of the
maximum value of E towards zero, and the resistor voltage is
decreasing from minus 20 volts towards zero. On each succeeding
halfcycle, the capacitor charges and then discharges from a slightly
higher value of voltage. Eventually, a point is reached where Ec
varies equally above and below the average value of E, while ER
varies equally
54


 Previous Page
