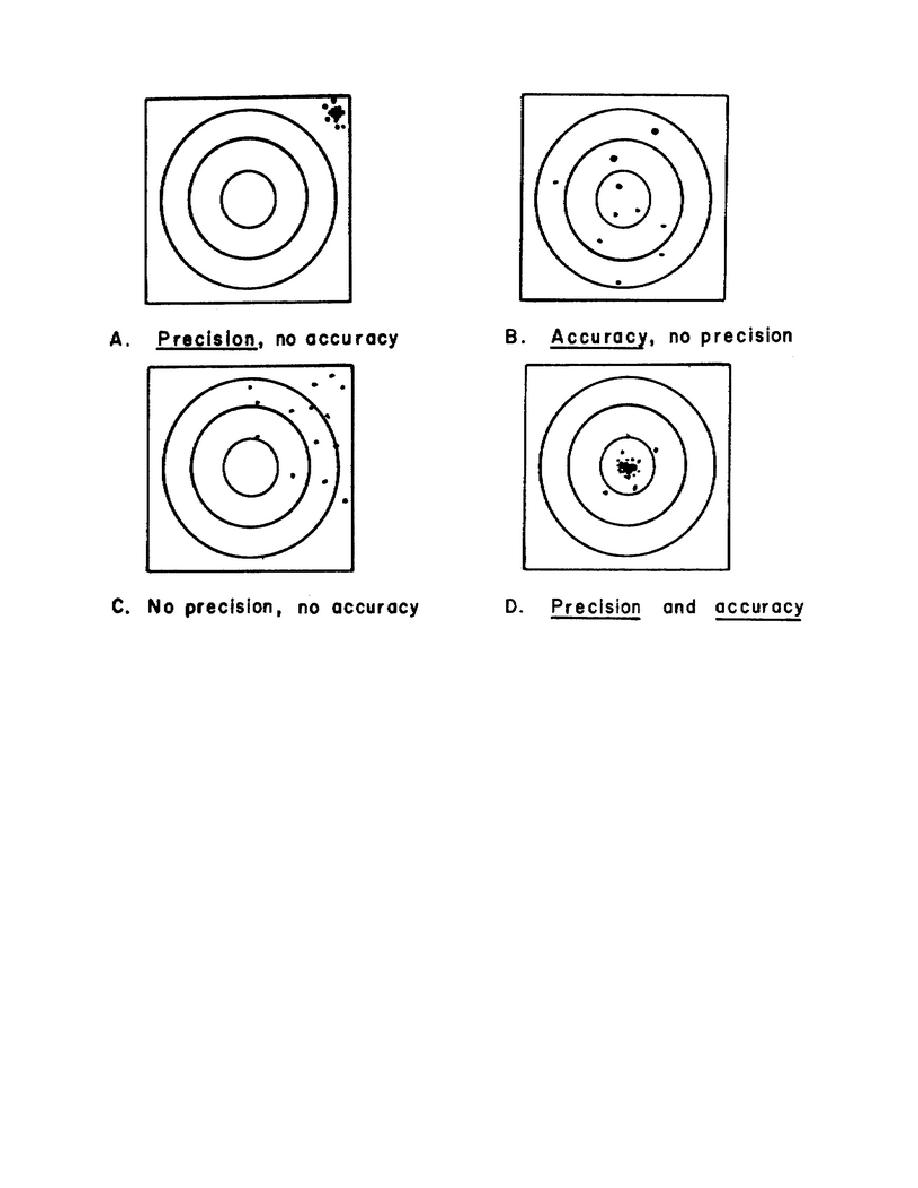
Figure 4.
(2) A group of observations of some particular value may have varying
degrees of precision, accuracy, or combinations of both.
6.
STATISTICAL GRAPHS.
a. General. After the observations are made and the data recorded, the
information is assembled, classified, condensed, and presented in some form
for analysis.
b. Frequency distribution.
(1) A frequency distribution is a plot or graph of numerical data
according to size or magnitude.
When this information is presented in
graphical form, considerable information can be obtained from it.
(2) For illustrative purposes, develop a frequency distribution from
a hypothetical situation. Suppose the A to Z Company manufactures mercury
thermometers and that the manufacturing process is such that errors are
about as likely to be over as under; also, large errors are
153


 Previous Page
