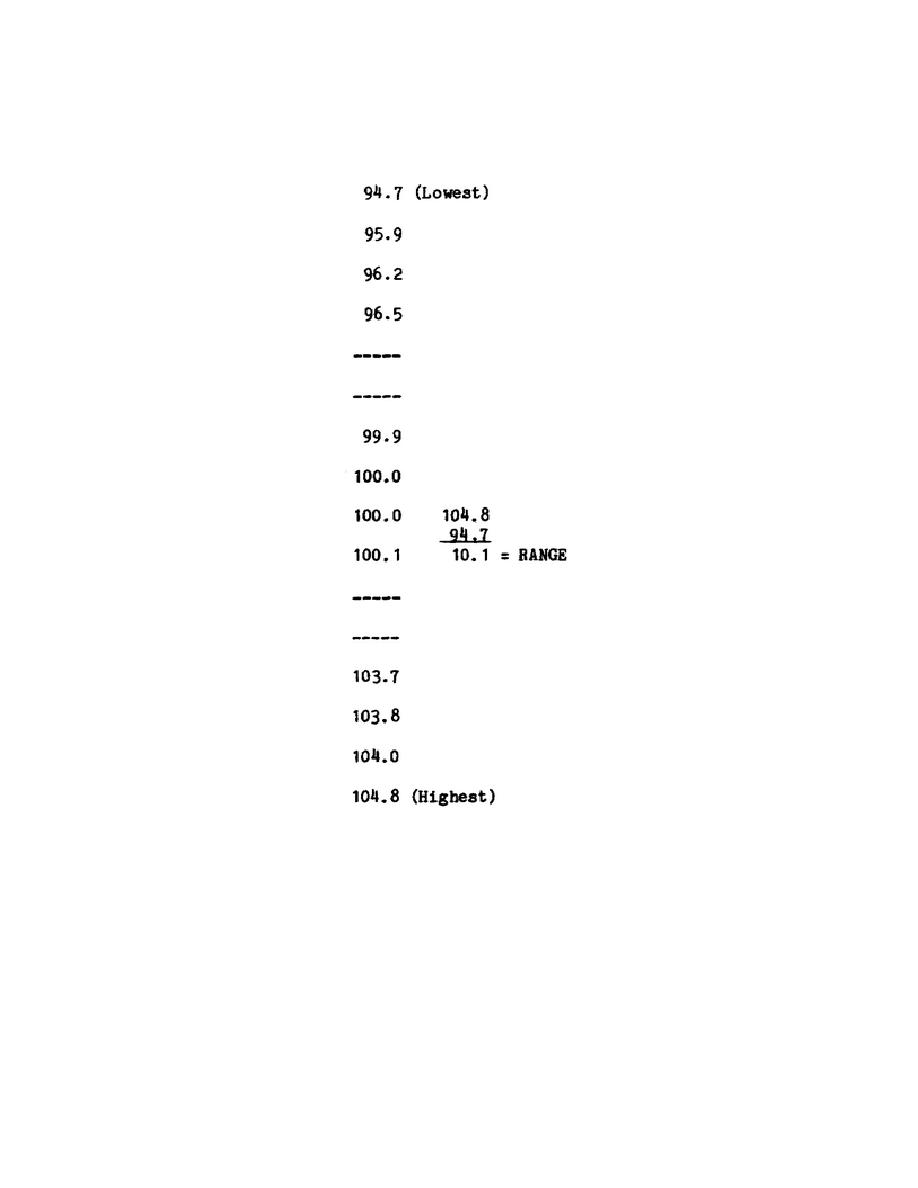
(3) He now has unsorted tabulated data, which are of little value in
their present form. He could rearrange these readings in RANK ORDER; that
is, put them in order of magnitude. Such an arrangement (below) is called
an ARRAY.
The RANGE of the distribution is found by subtracting the lowest value from
the highest value. That is how much the extreme values differ. But since
there are nearly as many different values as there are readings, the data in
this form furnishes little information other than the range.
(4) Before these figures can be graphed, they must first be grouped.
In order to see how densely the readings cluster about any given point, an
interval must be selected and the number of readings falling within that
interval must be counted (sometimes called class intervals) so that each
point falls at the midpoint of the interval.
156


 Previous Page
