MM0704, Lesson 4
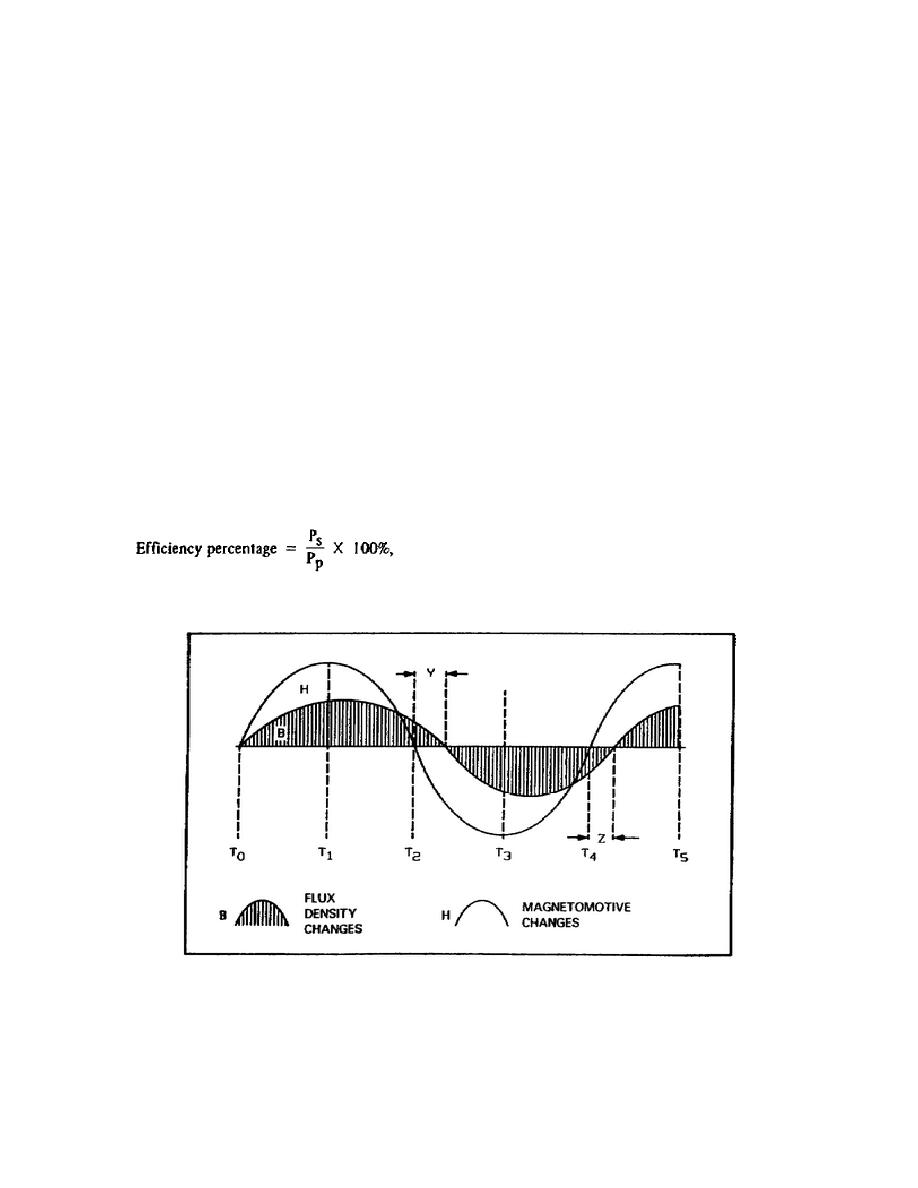
Curve B of figure 4-16 represents the flux density changes in relation to the magnetomotive changes (curve H). Note
that both the H and B curves start out from T0 and continue toward T1 in phase. When curve H reaches T1, it is at its
maximum value in the positive direction and begins to decrease toward T2, to complete the half cycle. Now, note
curve B. It does not reach the zero line until sometime later. The actual time distance is represented by space Y. To
complete the cycle, you can see that the H curve reaches zero before the B curve by a time equivalent to space Z.
When the core of the transformer is magnetized, the atoms of the core material will be aligned in one direction. As the
magnetizing force decreases to zero at T2 (figure 4-16), the magnetizing action of the AC leaves the atoms of the core
lined up for a period of time corresponding to space Y. This is what causes the flux to lag behind the magnetomotive
force. The magnetism left in the core material after H has reduced to zero is called residual magnetism. When AC is
used to magnetize the core, whatever residual magnetism placed in the core in one-half cycle is overcome in the next
half cycle because of the reversal of polarity.
At points Y and Z in figure 4-16, where residual magnetism is present, it requires energy from the magnetomotive force
to overcome it. This energy is dissipated as heat in the core. This waste of energy is the hysteresis loss and must be
kept to a minimum for efficient operation.
The losses due to hysteresis and eddy-currents, iron losses along with I2R (copper) losses make up all the transformer
losses. Due to these losses, the transformer cannot be 100-percent efficient. Therefore, the power taken from the
secondary can never equal the power applied to the primary. You can find efficiency of a transformer from the
following equation:
where Ps is total power in the secondary, and Pp is total power in the primary
Figure 4-16. Flux Density and Magnetomotive Force.
91


 Previous Page
