MM0704, Lesson 4
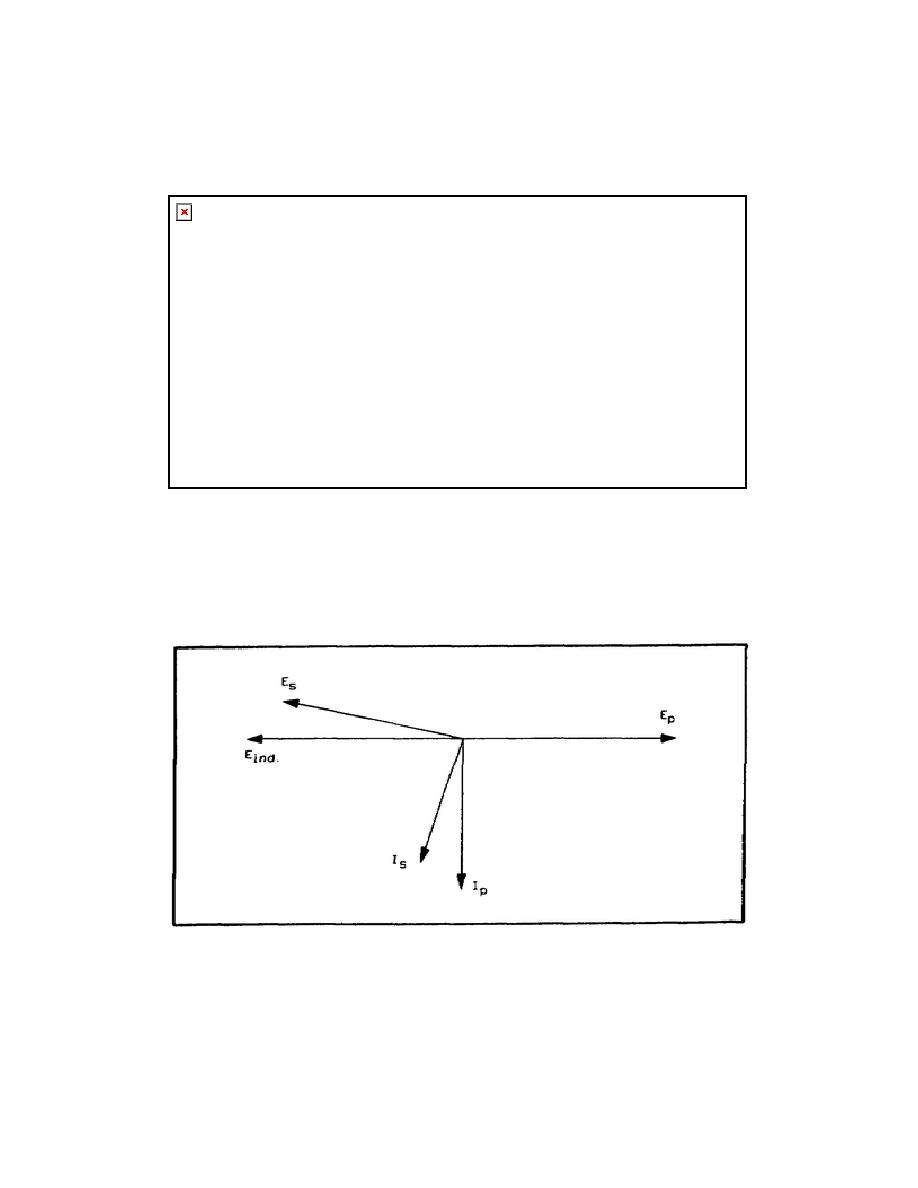
Eind until a frequency is reached at which the circuit becomes predominately inductive. At this time, Is lags Eind
about 90. Again, there is an output across the capacitor, and the voltage lags the secondary current by 90. Note that
the secondary voltage is almost in phase with the primary voltage in this case.
Figure 4-23. Vector Diagram of Applied Frequency Higher than Tuned Frequency.
At a frequency below the resonant frequency, the resultant vector would appear as in figure 4-24. The secondary, in
this case, would act capacitively, and the current would be leading Eind by almost 90 by the time the frequency was
decreased to a point where the circuit would be predominately capacitive. In this case, the secondary voltage is
approximately 180 out of phase with the primary voltage.
Figure 4-24. Vector Diagram of Applied Frequency Higher than Tuned Frequency.
By changing the inductance or capacitance in the secondary (frequency in this case being constant), the degree of phase
shift between the primary and secondary voltages can be varied anywhere from practically 0 to nearly 180.
96


 Previous Page
